
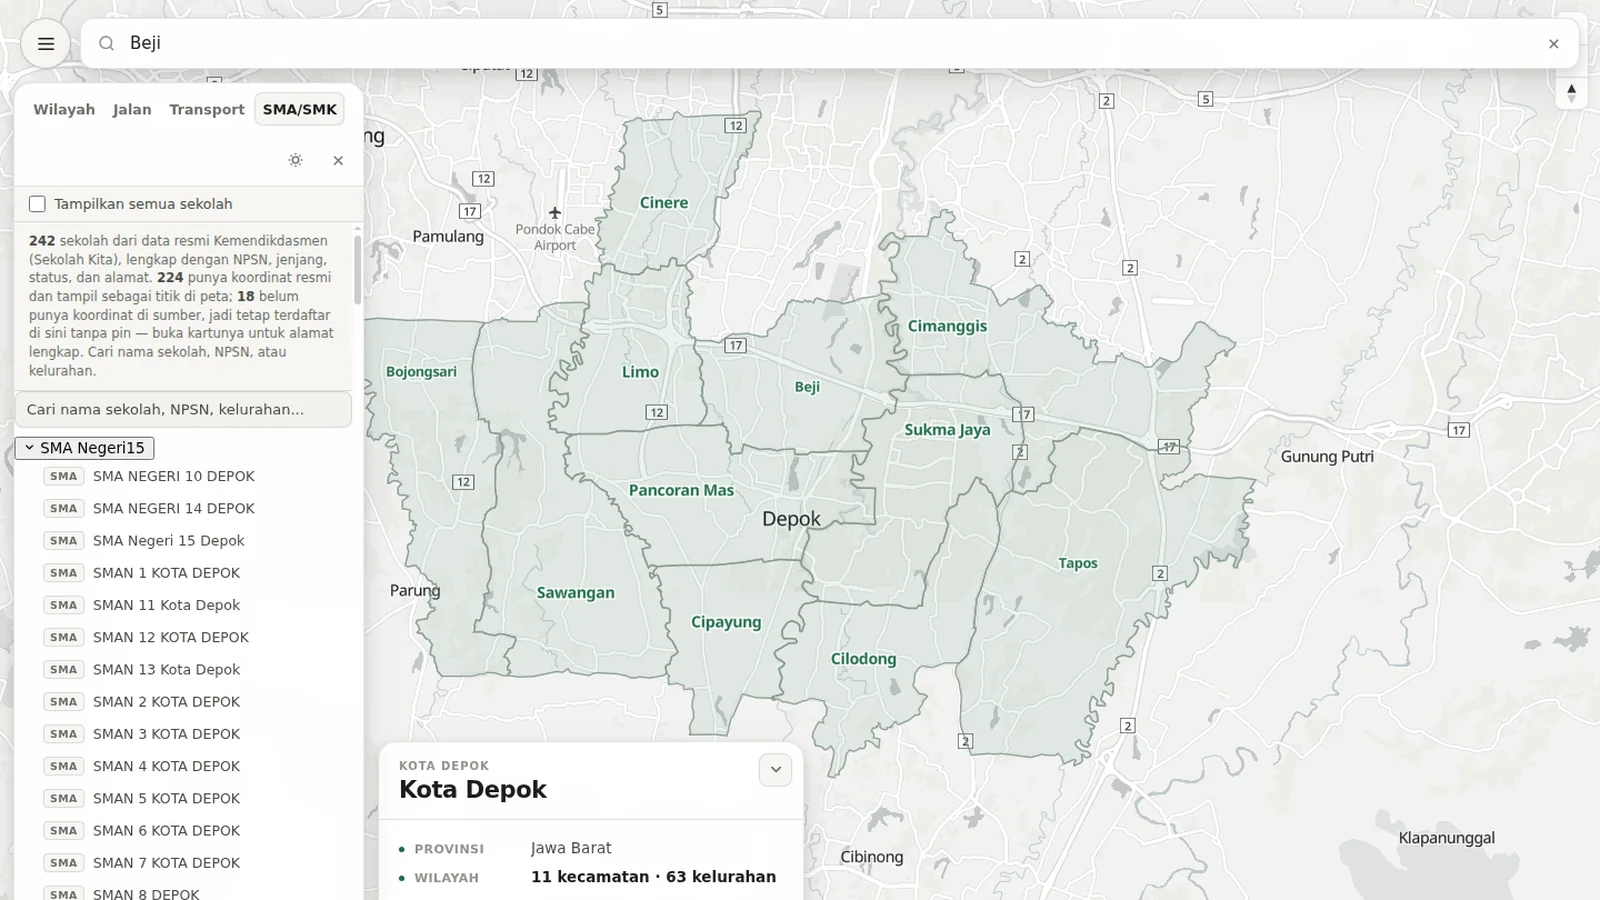
depok-map — implementation case
Implementation focus: assemble a city map from official government sources, keep it honest about what the data does and does not contain, and ship it as a static site with no backend.
Problem
Kota Depok's public map services are either unusable offline or inconsistent between layers. Roads, administrative boundaries, public transport routes, and schools each come from a different authority, in a different format, with a different identifier scheme.
The specific difficulty was defective source data. A school coordinate published as 0/0 is not a location. A latitude published as +6.3856 is not wrong in isolation — it is a real latitude somewhere in Indonesia — but it puts a school in Sulawesi, 1,400 km from Depok. Building a map on top of that requires validating coordinates rather than trusting them, and deciding what to do when a record simply has none.
Implementation
A static site: index.html, one vendored MapLibre build, and four generated JavaScript payloads. No framework, no build step, no backend. It is served from a CDN and the only runtime dependency is the basemap tiles.
The data is assembled by Python scripts that fetch from source, cache the raw responses, validate, and emit the payloads as committed .js files loaded through <script src>.
What is in the map:
- 63 kelurahan inside 11 kecamatan, from HDX/BPS administrative boundaries, each with its official BPS code
- 77 official roads from the city's spatial plan (Perda Kota Depok No. 9/2022, Pasal 16), matched to geometry by name — 74 of 77 matched, and the three that did not are kept as text rather than guessed at
- 46 angkot routes (16 within the city, 30 cross-border) from OpenStreetMap, plus 8 retired routes listed as inactive
- 242 secondary schools at coordinates published by the ministry
Decisions and constraints
The biggest coordinate problem was invisible to a range check. One school is published at latitude +6.3856. A latitude-range validation passes it, because +6.38 is a legitimate latitude in Indonesia. What identifies it as a typo is that the point misses the city polygon and its negation lands 106 m inside it. So the sign correction is gated on the city boundary, not on a plausible range — a check that would have accepted the bug.
A missing coordinate is not a school to hide. 18 of the 242 schools publish 0/0, and one publishes a near-null-island value about 11,900 km away. Rather than drop them or attach a fabricated pin, they stay in the list and searchable, carry a "no pin" badge, and their card states plainly that the source has no coordinate. The same applies to the three unmatched roads.
Never invent a location. Where a source lacks a coordinate, the map shows nothing at that point. Every GeoJSON path is gated on the coordinate being present and finite, so a null can never produce an invalid feature or break the viewport fit.
Reproducible over live. Every upstream response is cached to disk by its identifier, so a rebuild makes zero network requests and produces a byte-identical payload. That is what makes the generated data reviewable: the claim "this is what the source said" is checkable, because the source bytes are in the repo.
Generated data is committed, not fetched at runtime. The payloads are ~1.7 MB of JavaScript in total. Serving them as committed files means the site has no API dependency, no cold start, and no runtime failure mode when an upstream service is slow. The deploy step prunes the source JSON and the build scripts, which the browser never loads.
Separate the shipped app from the work. The public repository holds only what a browser downloads plus the scripts that generate it. Design notes, the offline test harness, a canonical-data-model experiment, and one-off API probes live in a separate private checkout. The dependency runs one way: the lab reads the app's payloads, never the reverse.
Outcome
The live application at depok.dibotak.com covers the city's full administrative hierarchy, its official road names, its angkot routes, and every registered secondary school with an official coordinate where one exists. The four-tab interface works down to a 390 px viewport, and each tab is served from its own generated payload.
224 of 242 schools are plotted, from coordinates published by the ministry rather than geocoded. The source is the ministry's own portal, reached through a public JSON API that documents neither itself nor its rate limits — the two behaviours that fail silently, a region filter that wants a name rather than a code and a zero-based page index, cost more debugging time than the rest of the data pipeline combined.
No usage or business-impact metrics are claimed here.
Stack
Plain JavaScript, MapLibre GL JS, HTML, and CSS on the front end; Python 3 with the standard library for the data pipeline. Upstream data from the Ministry of Primary and Secondary Education (Sekolah Kita), HDX/BPS, OpenStreetMap via Overpass, and the city's spatial plan. Static hosting with no server-side runtime.